|
|
At the end of the day, Mr. X broke even despite the market downturn. Mr. Y who
made a lump sum of RM1200 investment in Period 3 suffered a greater loss of RM400
as his investment cost was higher.
The average cost for Mr. X is lower because he bought more shares at lower prices.
The above example shows that dollar-cost averaging reduces your average purchase
cost over a period of time compared to a single lump sum purchase.
Nevertheless, the method is not without criticism - do you continue to make regular
purchases when the market or the price of the security continues to fall. However
consider this - will any stockmarket continue to drop to nothing?
After the sharp sell-off experienced by the Kuala Lumpur Stock Exchange last year,
the market seems to have stabilized at the moment. Although sustained recovery may
be a bit premature over the short-term, the market will eventually recover to its
pre-crash territory when all the problems have been resolved.
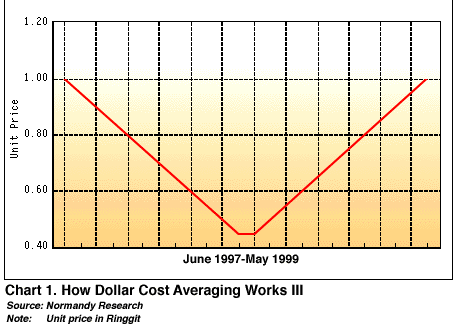
Let us take a look at another illustration. Suppose you started your monthly investment
of RM1000 in June 1997 and bought unit trust ABC at the price of RM1.00 sometime
before the stockmarket crash. The price plunged as low as 45 sen at one stage.
Having bought almost at the peak, you grumble about the slow recovery of the market
and you are now contemplating on quitting in the middle of the program. The price
now stands at 50 sen. If you had decided to cut loss, what will be the opportunity
cost over a certain period when the unit price eventually recovers to its original
purchase price?
Table 2. How Dollar cost Averaging Works II
|
Period
|
Price
(RM)
|
Monthly
Investment
(RM)
|
Units held
|
Total units held
|
| June 1997 |
1.00
|
1,000
|
1,000
|
1,000
|
| July |
0.95
|
1,000
|
1,053
|
2,053
|
| August |
0.90
|
1,000
|
1,111
|
3.164
|
| September |
0.85
|
1,000
|
1,176
|
4,340
|
| October |
0.80
|
1,000
|
1,250
|
5,590
|
| November |
0.75
|
1,000
|
1,333
|
6,924
|
| December |
0.70
|
1,000
|
1,429
|
8,352
|
| January 1998 |
0.65
|
1,000
|
1,538
|
9,891
|
| February |
0.60
|
1,000
|
1,667
|
11,557
|
| March |
0.55
|
1,000
|
1,818
|
13,375
|
| April |
0.50
|
1,000
|
2,000
|
15,375
|
| May |
0.45
|
1,000
|
2,222
|
17,598
|
| June |
0.45
|
1,000
|
2,222
|
19,820
|
| July |
0.50
|
1,000
|
2,000
|
21,820
|
| August |
0.55
|
1,000
|
1,818
|
23,638
|
| September |
0.60
|
1,000
|
1,667
|
25,305
|
| October |
0.65
|
1,000
|
1,538
|
26,843
|
| November |
0.70
|
1,000
|
1,428
|
28,272
|
| December |
0.75
|
1,000
|
1,333
|
29,605
|
| January 1999 |
0.80
|
1,000
|
1,250
|
30,855
|
| February |
0.85
|
1,000
|
1,176
|
32,032
|
| March |
0.90
|
1,000
|
1,111
|
33,142
|
| April |
0.95
|
1,000
|
1,053
|
34,195
|
| May |
1.00
|
1,000
|
1,000
|
35,195
|
Source:Normandy Research
Note: Figures may not be exact due to rounding
Total investment after 2 years = RM24,000
Total units held after 2 years = 35,195
Average purchase price = RM0.68
Profit : RM35,195 - RM24,000 = RM11,195
Assume that the unit price goes back to the initial buying price at RM1.00 tracking
the general market recovery after say 2 years, you make a profit of RM11,195 or 46.65%.
Your opportunity cost is a gain of over 40% return.
Investors need to be disciplined when adopting such a policy. The program works to
its maximum when you stick to it rain or shine. Your investment will bear fruits
over the long-term. Long-term investors should sit tight and not worry too much about
short-term fluctuations.
It is impossible for markets to keep rising or falling. If you are constantly jumping
in and out of markets trying to time the markets, you will end up the loser. Since
timing the market is difficult even for the best traders, a better strategy would
be to top up further when the market is down and make sure that you do not miss the
big days - when the bulls stampede the bears.
Dollar cost averaging ensures that you do not miss the big days. You would receive
better protection for your hard-earned money. Be a long-term investor.


|


